Gantt charts. Love ‘em, hate ‘em, or can’t live without ‘em, they’re a reality of a marketer’s life. But how do you make yours stand out from the rest?
I’ve gathered some of the best examples around, along with some free templates to get you started. Dive in below and find your favorite. But first ...
What is a Gantt Chart?
Gantt charts provide a way to track and manage project timelines, progress, and deliverables. Vertical lines or bars are used to visualize each task, and each Gantt chart includes resources, milestones, tasks, and dependencies.
- Resources: Project managers must have insight into what resources are needed for tasks outlined in a Gantt chart, in order for each to be completed on time.
- Milestones: Along your timeline, there will likely be milestones, both small and large, that must be hit in order to keep your project on track. A milestone for a blog launch might be, “Blog post draft due on 5/30.”
- Tasks: There are specific things that need to be completed along the way of your project. In our blog post example, a task might be, “Edit blog post.”
- Dependencies: Tasks on your Gantt chart will be related to each other, for example, the editor won’t be able to complete her task of editing the blog post until the writer has met their milestone and submitted their draft on 5/30. These are dependencies and should be noted in your chart.
The main goal of a Gantt chart is to track the timeline and completion of a project. It’s especially helpful for project managers who need to keep team momentum going on campaigns with many moving parts, like product launches or marketing events.
You can create Gantt charts in Excel, PowerPoint, Google Sheets, and more, and this tracking method can be used in a variety of industries, from marketing to construction, and even design.
So, what does that look like? Let’s dive in with some beautiful Gantt chart examples, below. Prepare to geek out.
Gantt Chart Examples
1. Gantt Chart in PowerPoint
Want to include a Gantt chart in your next PowerPoint Presentation? Use this PowerPoint example as your guide. PowerPoint doesn’t have a built-in Gantt feature, but you can build and edit a chart inside of the platform using their “Stacked Bar” feature.
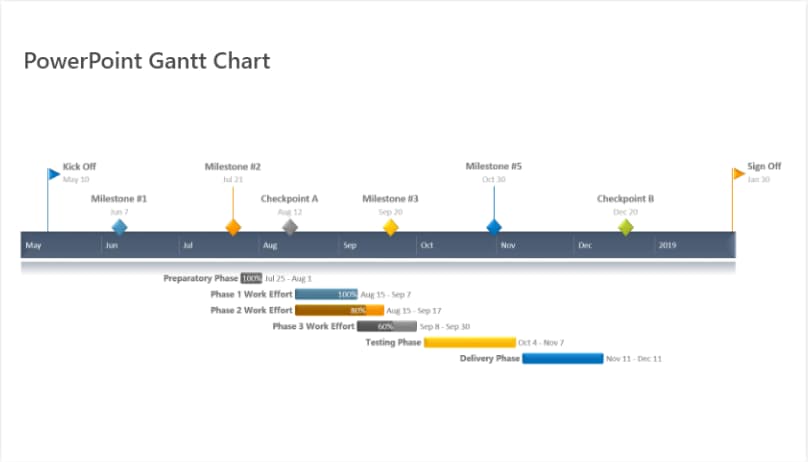 Image source: Office Timeline
2. Gantt Chart in Excel
Creating Gantt charts in Excel is a common practice and one you’ll likely come across in your work. Excel doesn’t have a predefined Gantt chart, but the “Stacked Bar” feature is your friend, once more, allowing you to show project progression. Here’s an example of an Excel Gantt chart. Download it free, here. 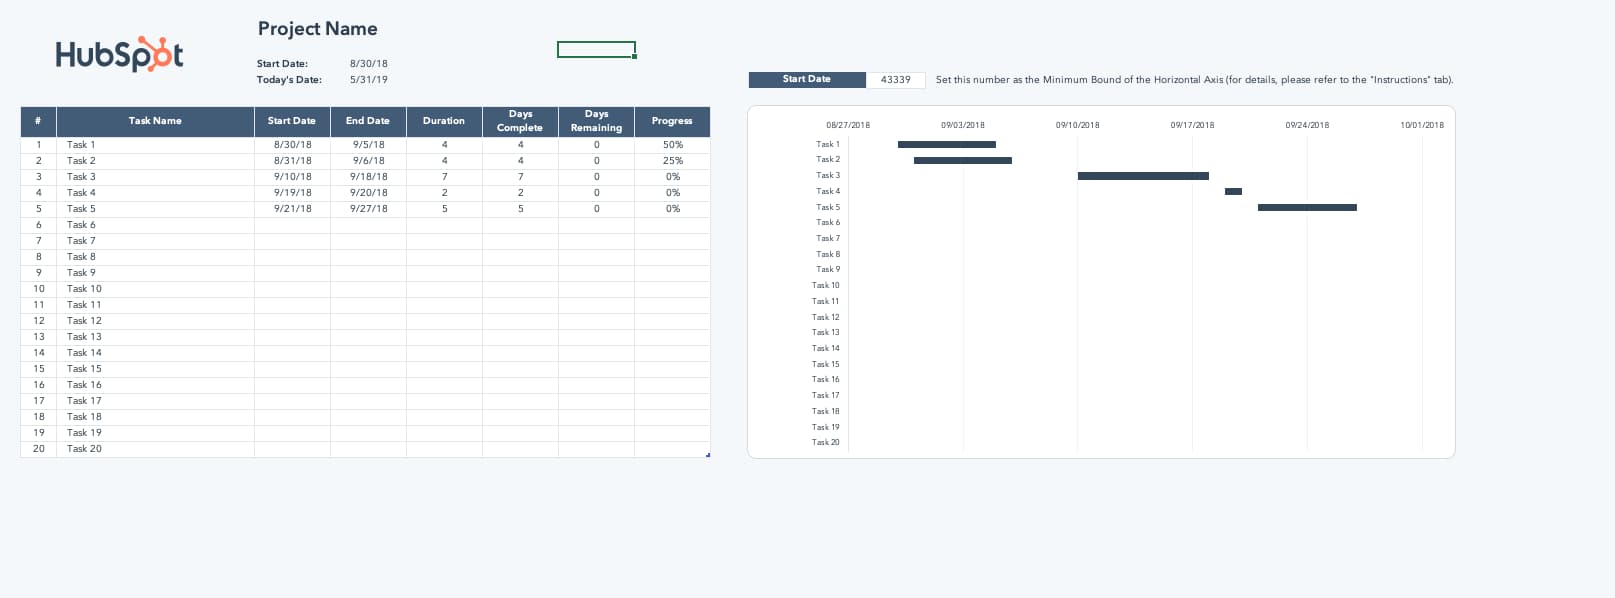
Image source: HubSpot
And here’s a helpful “how-to” video for the excel-challenged among us <raises hand>.
Image source: Smartsheet
3. Gantt Chart in Word
What’s that? You’re not familiar with Microsoft’s “Stacked Bar” feature yet? Well, if you’re getting friendly with Gantt charts, you’ll be using this go-to feature quite a bit.
If you’re creating a Gantt chart in Microsoft Word, you’ll stack bars once more. But if you’ll be updating and tweaking your Gantt chart regularly, Excel or PowerPoint may give you better flexibility. 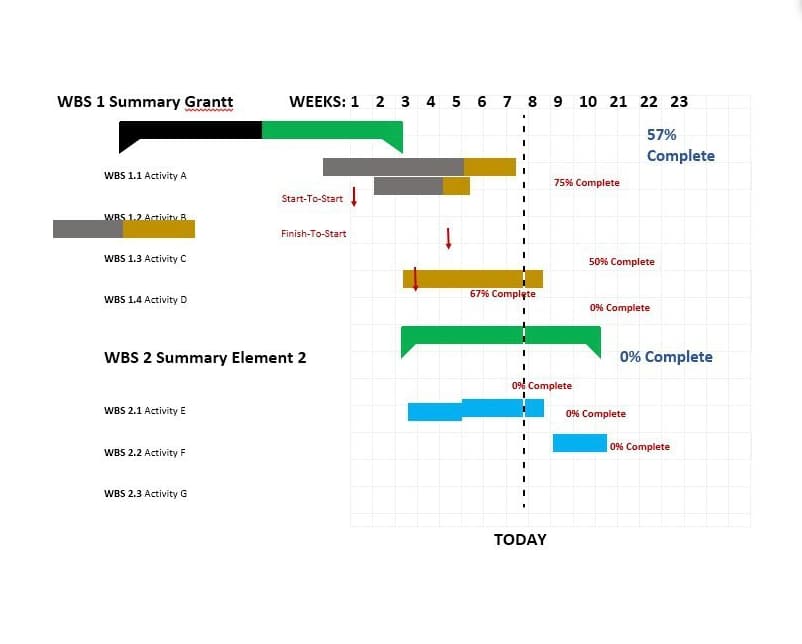
Image source: Template Lab
4. Gantt Chart in Google Sheets
If Google Sheets is where you spend most of your time, this is the Gantt chart for you. G-Sheets makes it easy to build customizable Gantt charts you can edit as needed -- all using a few simple formulas.
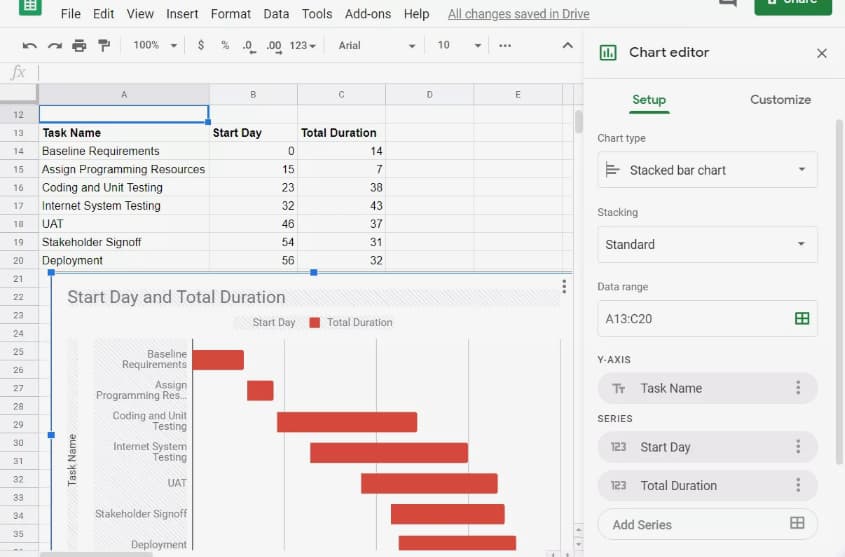 Image source: Lifewire
5. Gantt Chart in Google Docs
Want a Gantt Chart you can share and collaborate on with colleagues? Consider creating your chart in a Google Document. Save it to your Google Drive and share as normal. Google offers “Stacked chart” options in their “Chart Editor,” so getting started is a breeze.
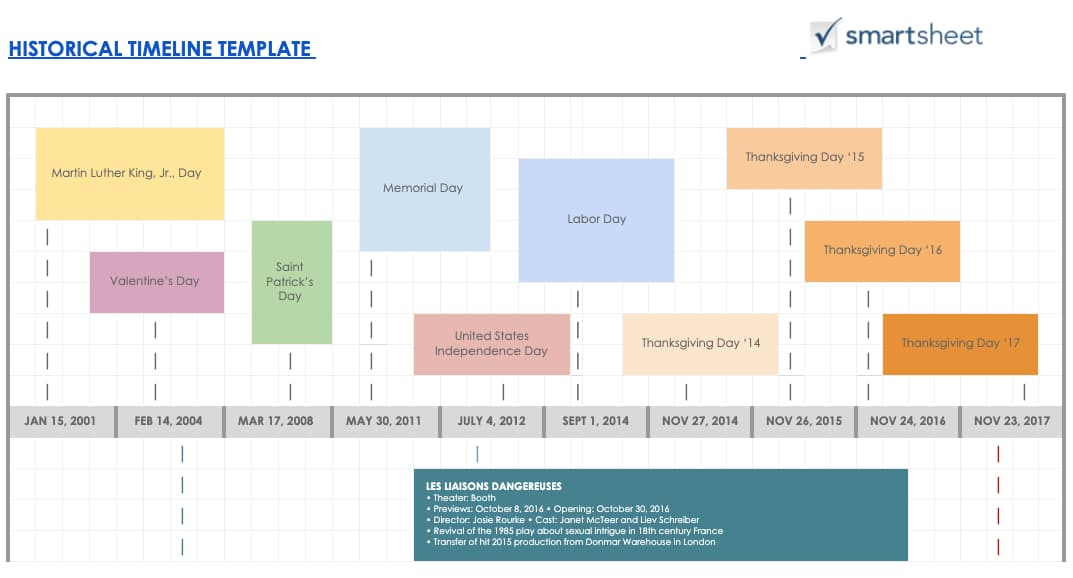 Image source: Smartsheet
6. Gantt Chart for Editorial Calendar
Take your editorial calendar up a notch with a Gantt chart. Include publication dates as your milestones, add subgroups for each phase of content creation, and add tasks to your chart.
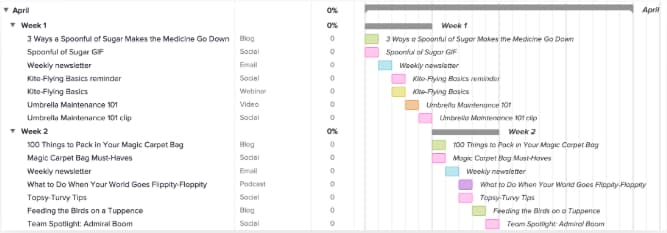 Image source: TeamGantt
7. Gantt Chart for Project Management
Project management is one of the most common verticals relying on Gantt charts. These charts help project managers identify the tasks involved in each project, create a timeline for each task, and assign dates, tools, and progress updates for each of the tasks within the project.
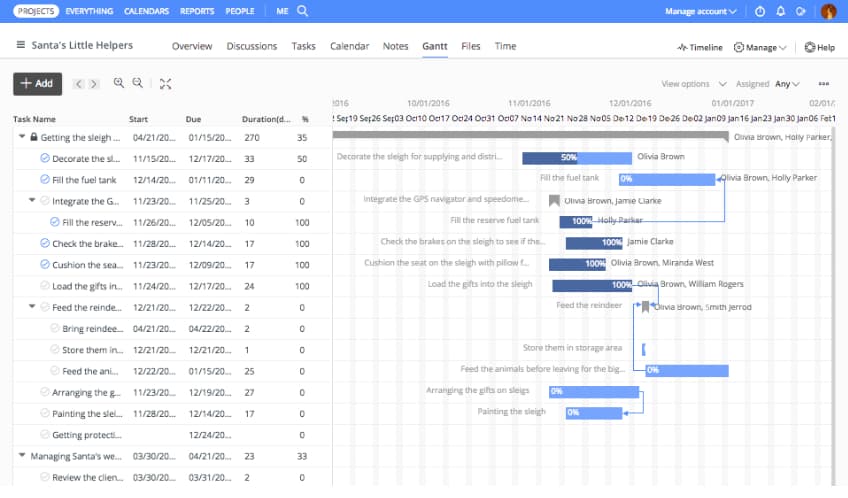 Image source: ProofHub
8. Gantt Chart for Marketing Campaign
There are many tools available that help marketers create Gantt charts especially for marketing campaigns. This example, from GanttPro offers ready-made campaign templates with predefined tasks, subtasks, and milestones. 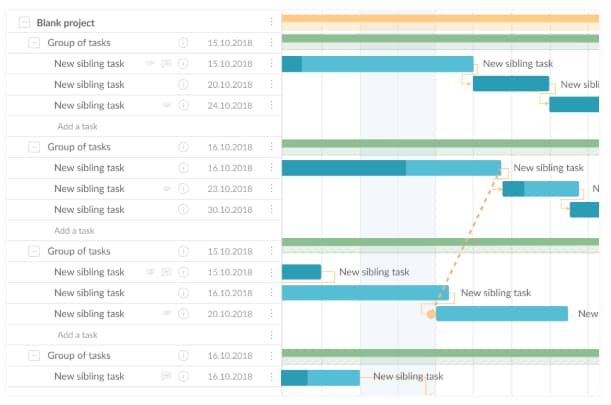 Image source: GanttPro
9. Gantt Chart for Design Projects
Designers, you can use Gantt charts, too. Plan design launches, track brainstorming, and share draft progress with a carefully organized chart, like the example below. 
Image source: SmartDraw
10. Gantt Chart for Product Launch
Product launches have many moving parts. Keep track of research, budgets, team roles, and even risk assessment in a customizable Gantt chart like this one. You can even set dependencies and assign tasks to certain people.
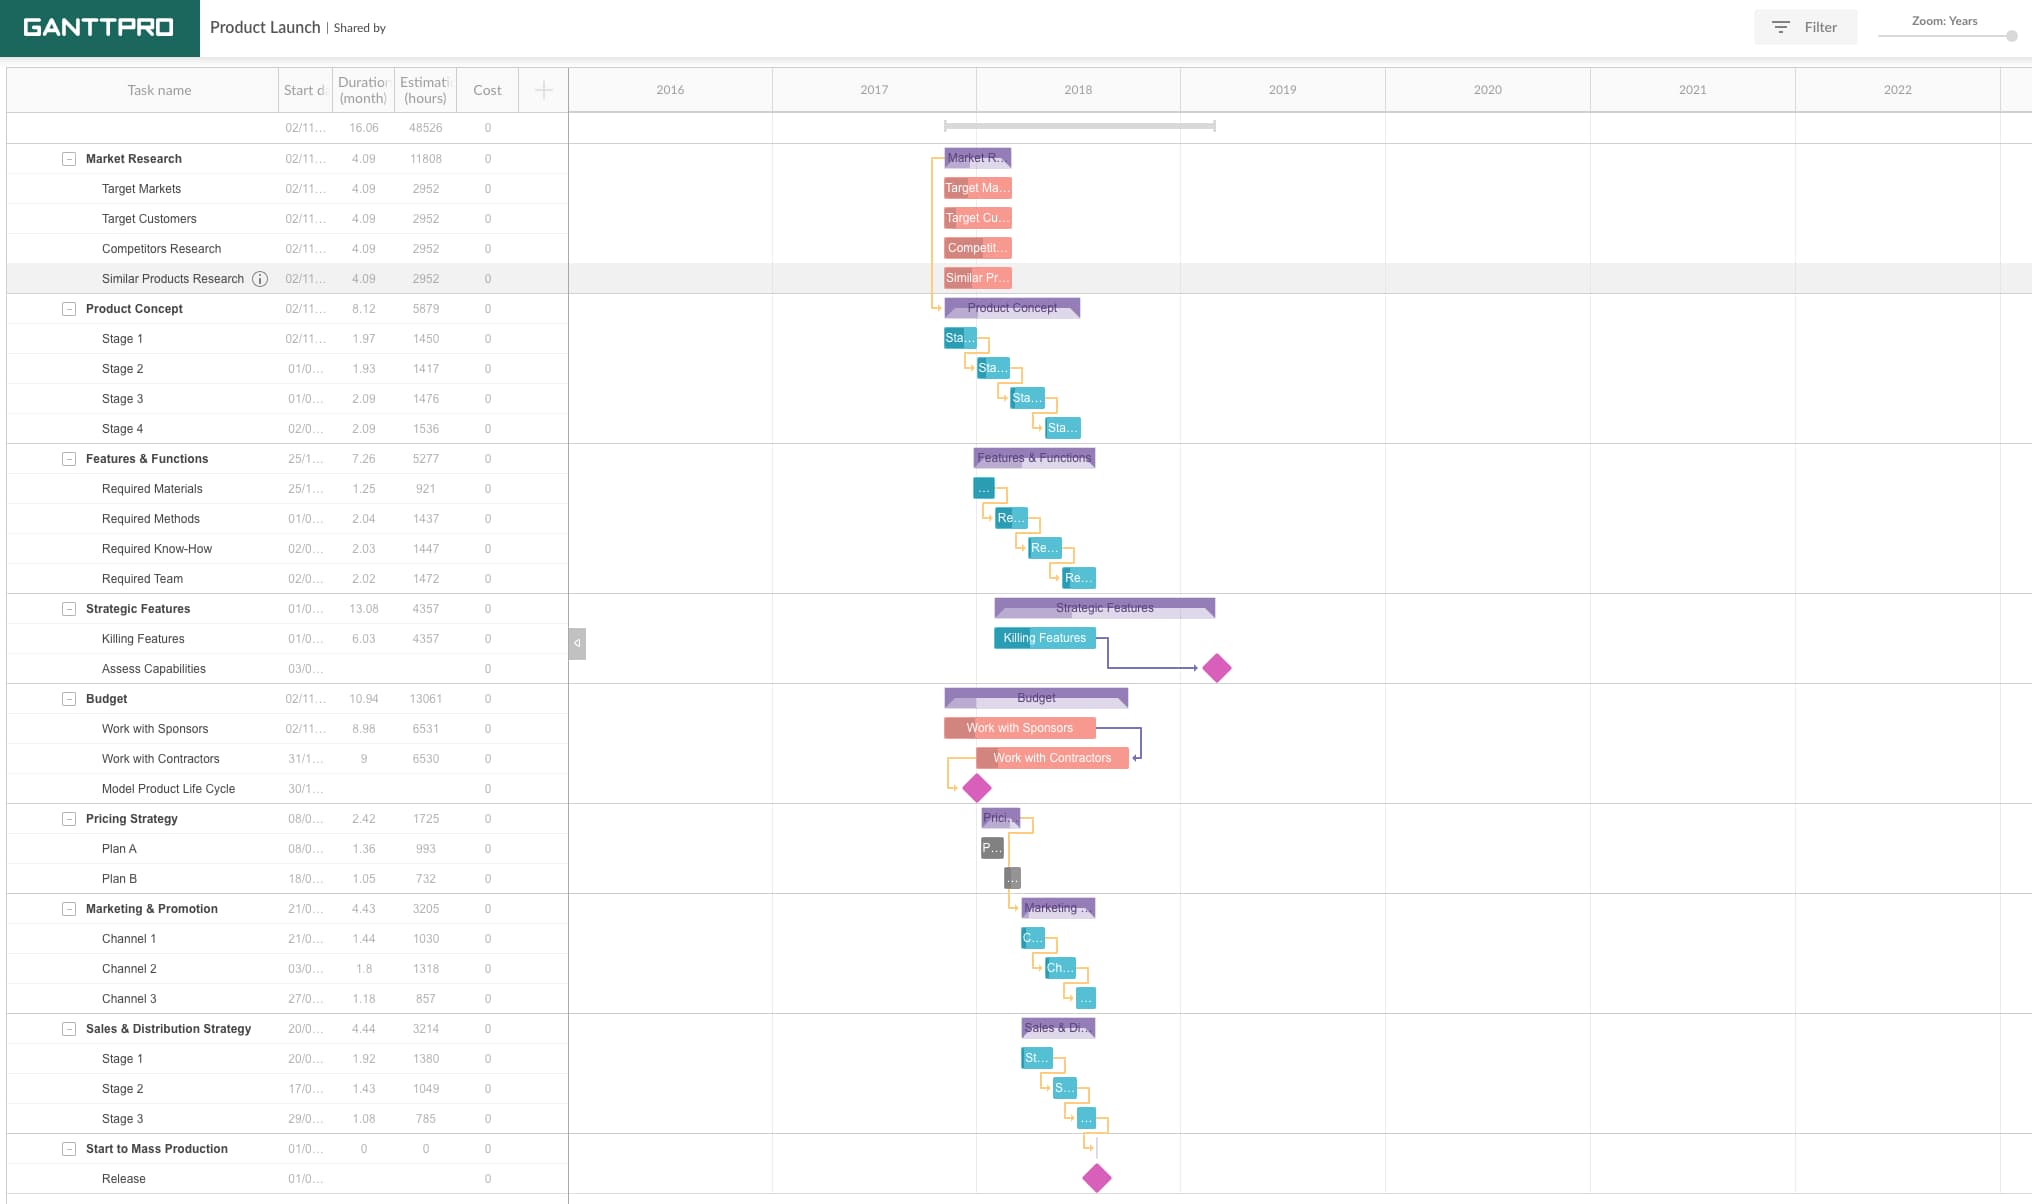 Image source: GanttPro
11. Gantt Chart for Social Media Campaign
When you’re mapping a social media marketing campaign using a Gantt chart, make sure to include the tools you’ll need, the content you’ll be sharing, and the assets used on each channel. We loved this example, from Fabrik. 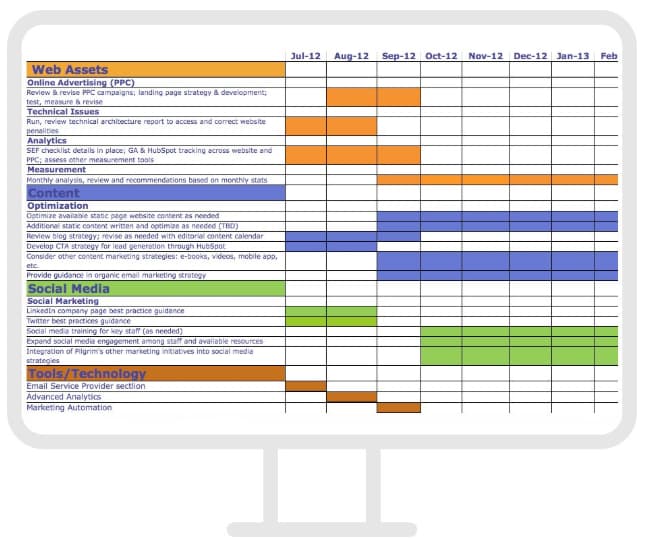
Image source: Fabrik
12. Gantt Chart for Event Marketing
From outreach prior to the event to “Thank you” emails once it’s over, planning an event requires high levels of organization. Use a Gantt chart like this one to keep track of your strategy, team progress, and key actions before, during, and after your event.
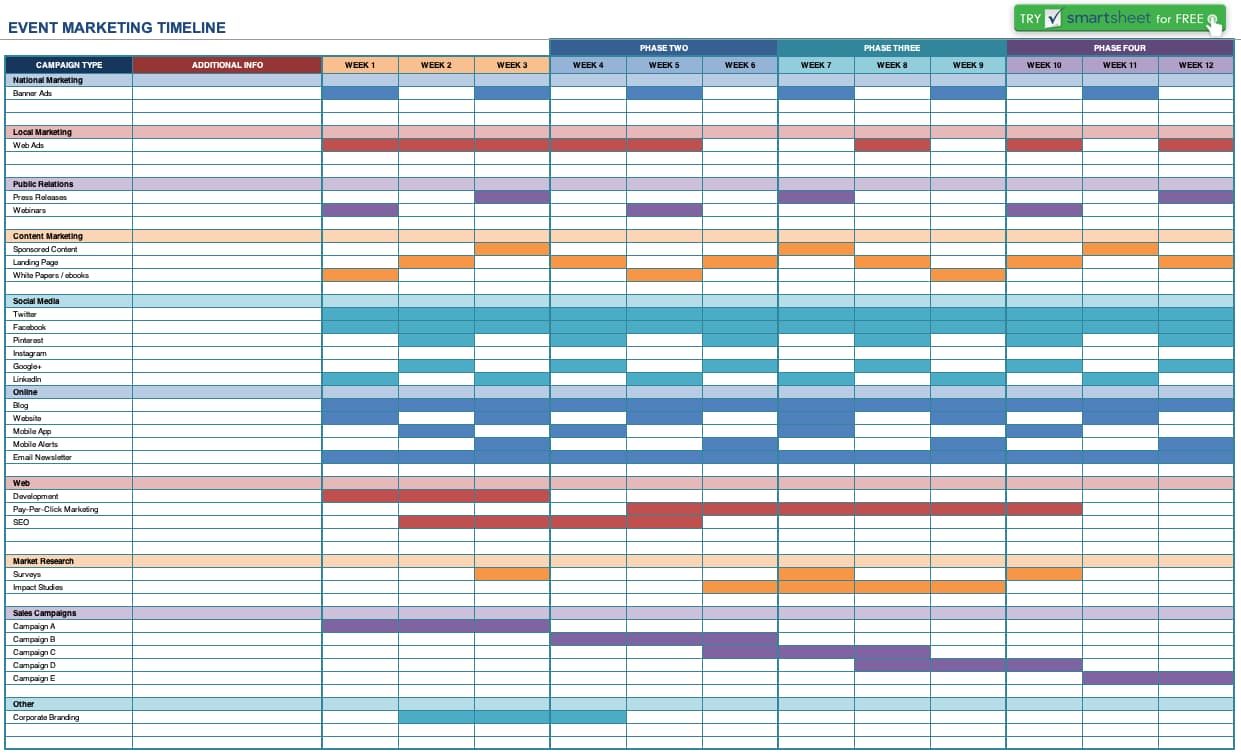
Image source: Smartsheet
Are Gantt charts only the beginning for you? Check out our guide packed full of the best marketing tools for every business and budget -- customized for this year.
No comments:
Post a Comment