The economic impact of COVID-19 is undeniable. Businesses all across the globe are learning how to adapt to these new circumstances. We’re all learning how to operate in a “new normal” that’s constantly changing.
That’s why from now until the end of June, we will be publishing week-over-week trend data for core business metrics including such as website traffic, email send and open rates, sales engagements, close rates and more. We plan to add additional cuts, like channel and region, over time.
This week, we’ve added an additional dimension to our dataset -- company size. You can explore all the data we’re publishing here.
About the Data
- These insights are based on aggregated data from over 70,000 HubSpot customers globally.
- The dataset includes weekly trend data for core business metrics in 2020, focusing on changes occurring during and after March 2020.*
- Charts in this post are measured against a benchmark on the y-axis. The benchmark for each metric was calculated by taking weekly averages from January 20, 2020 through March 9, 2020.
- The data from HubSpot’s customer base reflects benchmarks for companies that have invested in an online presence and use inbound as a key part of their growth strategy.
*The spread of COVID-19 has had a different timeline in different regions, so we are using the World Health Organization's declaration of a global pandemic on March 11, 2020 as our “official” start date.
NOTE: Because the data is aggregated from HubSpot customers’ businesses, please keep in mind that individual businesses, including HubSpot’s, may differ based on their own markets, customer base, industry, geography, stage, and/or other factors.
What We’re Seeing
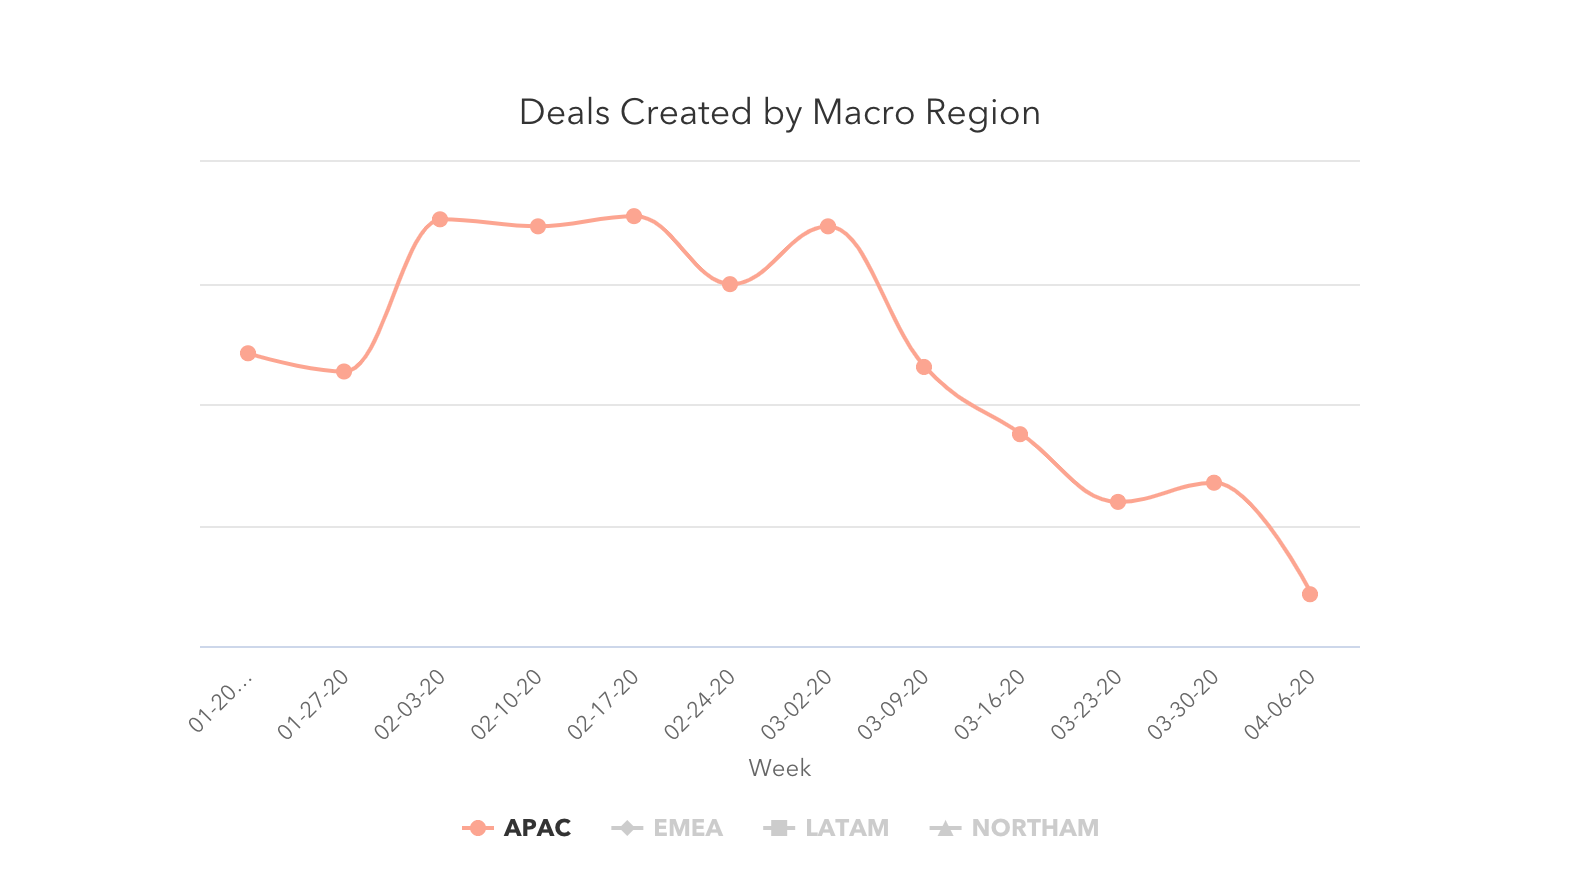
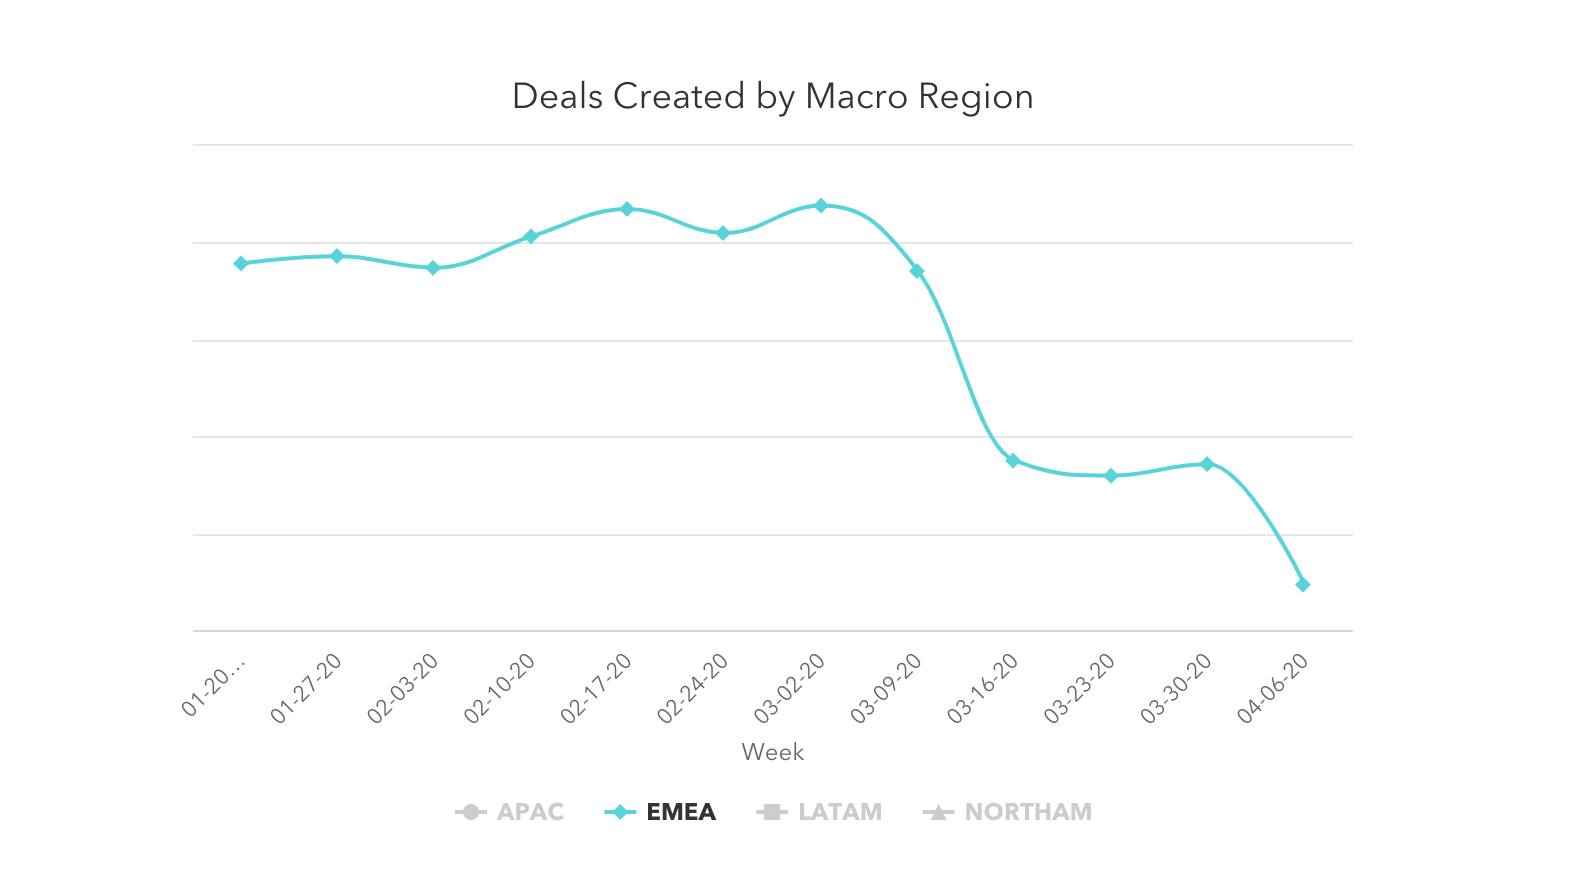
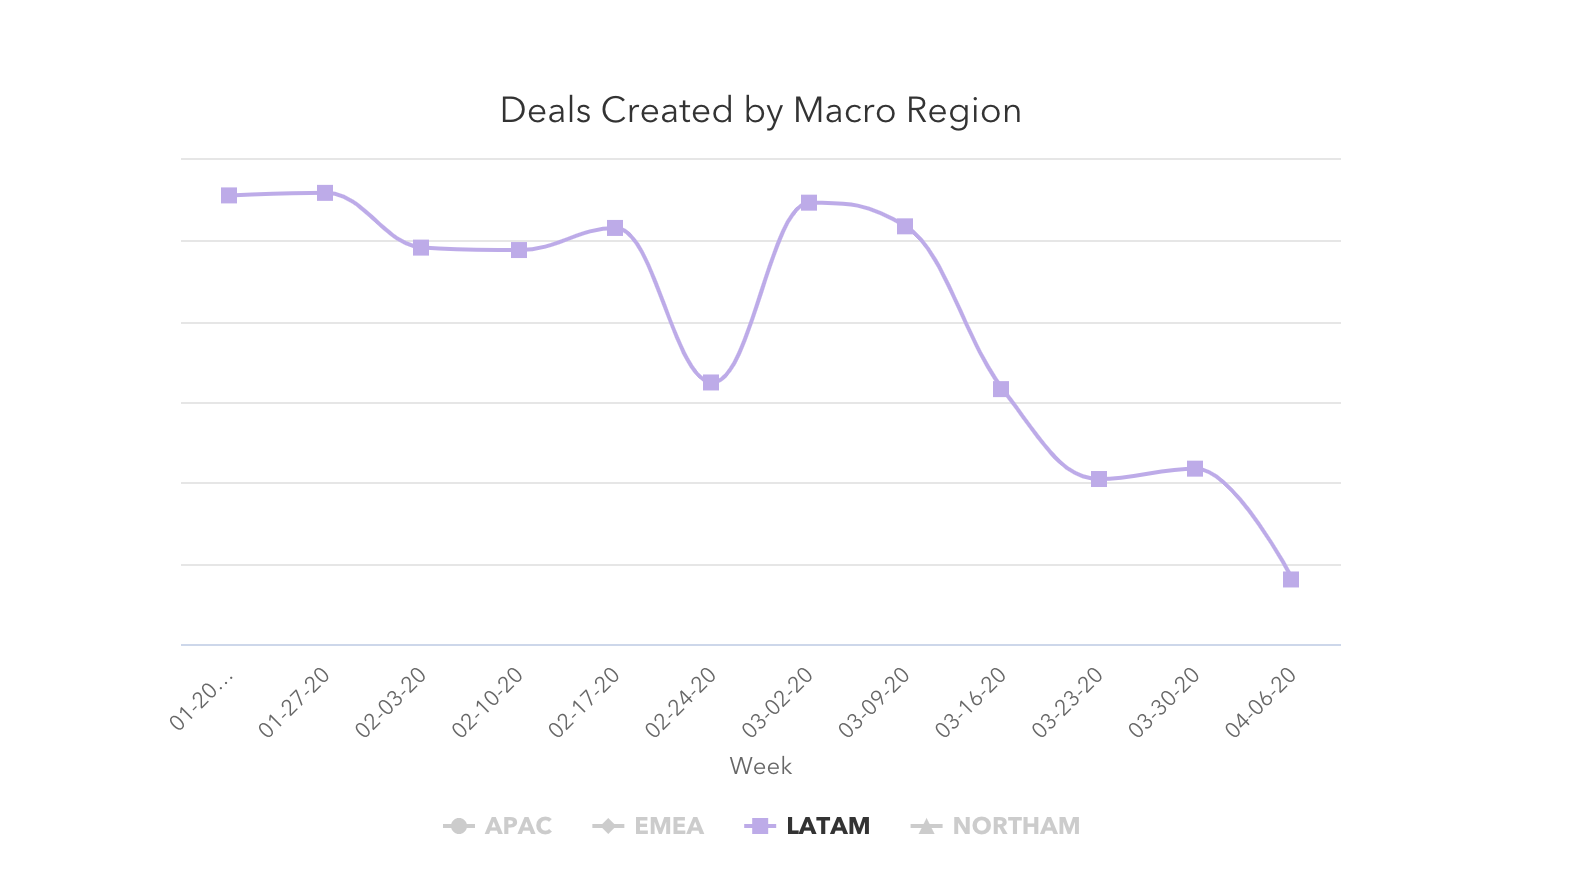
After a slight rally the week of March 30, both the number of new deals created and deals marked closed-won in HubSpot CRM dropped the week of April 6, particularly in EMEA and LATAM. The Easter holiday partially contributed to an end-of-week dip in deal volume in all regions, but deal creation was already trending downward before the holidays. As a leading indicator of future revenue, continued decreases in deal creation here don’t bode well for April and Q2 sales results. We will be watching this metric closely.
Sales teams are sending about 50% more email to prospects than they were pre-COVID, but responses continue to drop. Last week, sales response rates hit an all-time low for 2020 at 2.1%, a lower response rate than Christmas week 2019.
Like last week, marketers are having more success. Customers still seem willing to engage with marketing materials, as open rates climbed another 8% this week. Marketing email volume began to stabilize week-over-week, but the total volume of email sent is still far higher than pre-COVID levels.
Buyer-initiated chat and database growth suggest that interested customers are still out there. Chat volume, despite declining last week, is still far above pre-COVID averages. Database growth currently sits at February levels; while the aggressive growth of the last few weeks has slowed, it’s encouraging to see that the metric is still holding steady with historical averages for now.
Surprisingly, businesses of all sizes were impacted almost equally. Our data showed that buyers demonstrated neither a preference for supporting small businesses, nor a desire to buy from more established and stable companies. You can explore the entire dataset here.
How Metrics Changed in March
The number of deals created continues to decline, particularly in EMEA and LATAM.
After a slight end-of-quarter rally the week of March 30, the number of deals created dropped 11% the week of April 6.
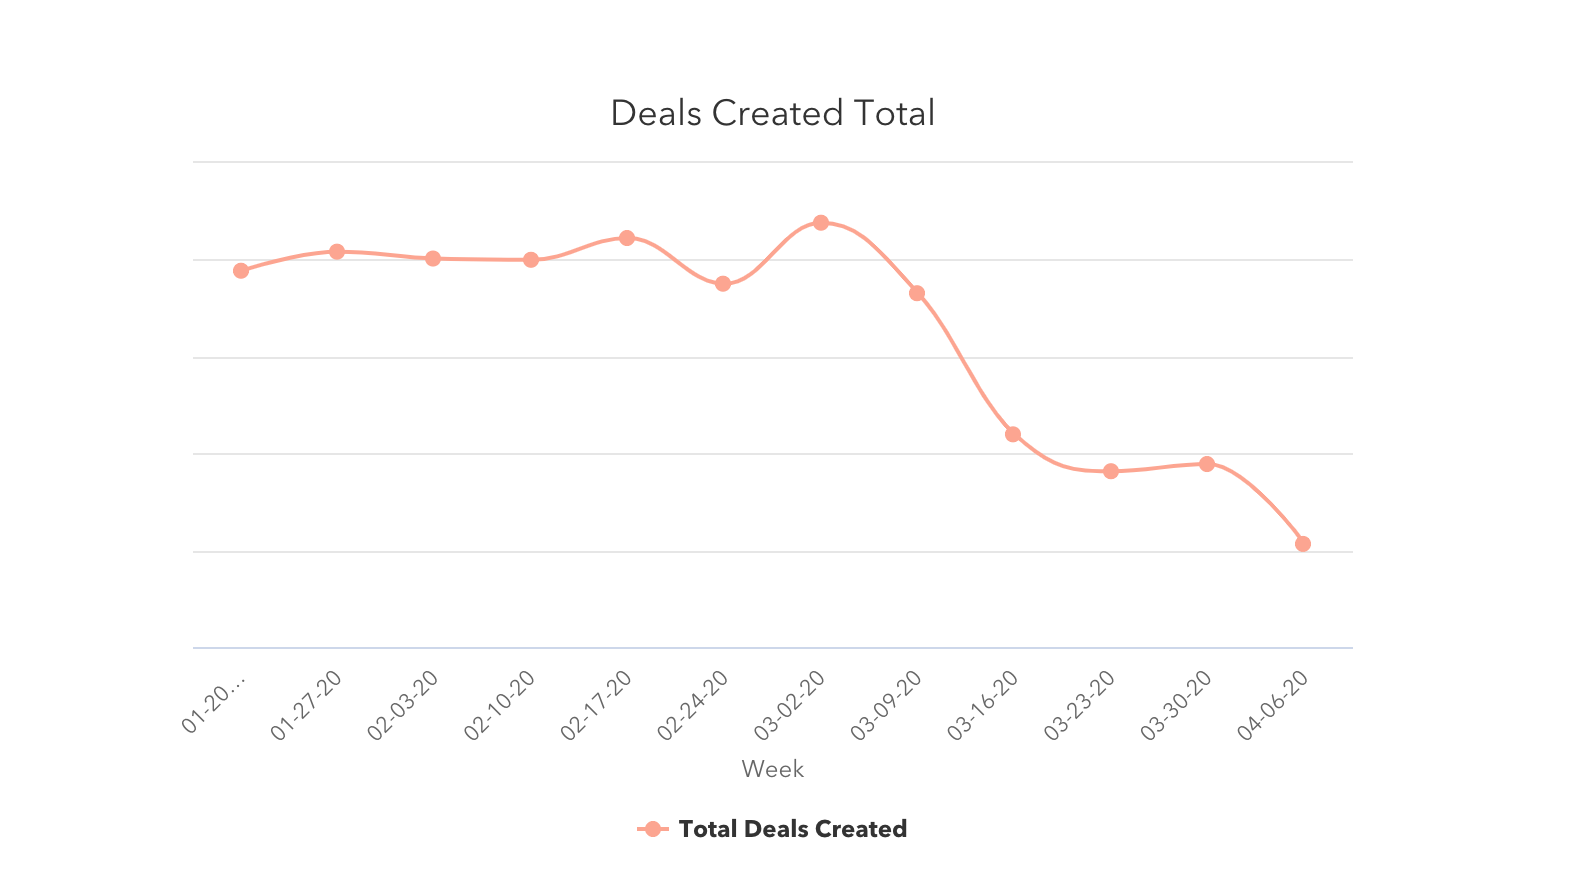
Deals created are down in every region. North America saw the smallest decline (a 3% decrease the week of April 6). EMEA and LATAM had the biggest with 19% and 16% drops, but it’s worth noting that business closures for Easter may have contributed to the drop in these regions.
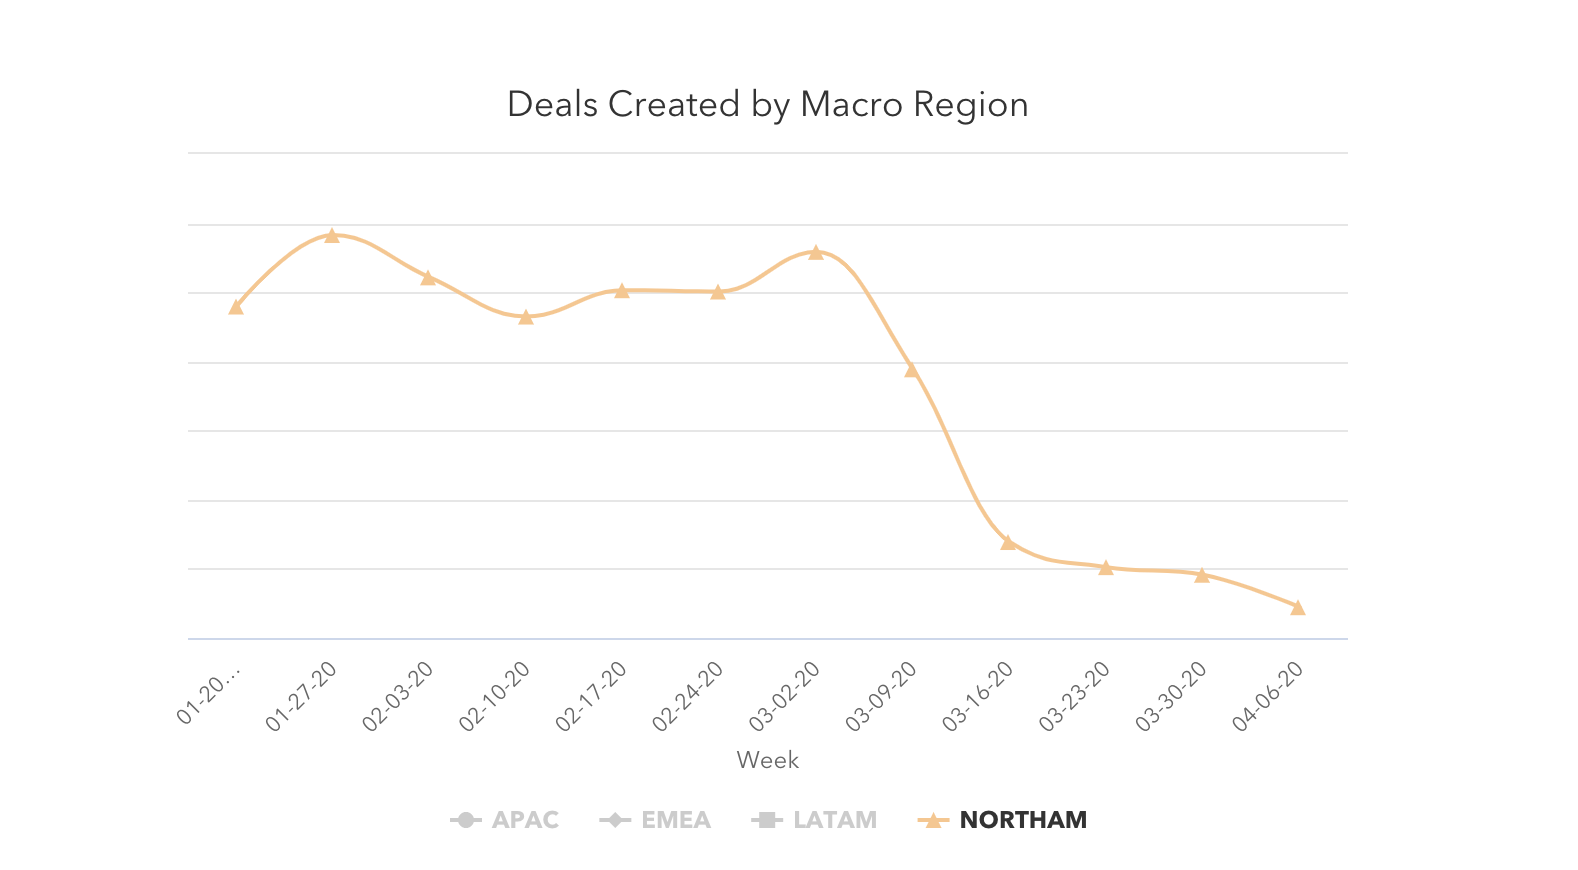
Deals closed dropped 19% as well, though we expect to see this happen between an end-of-quarter week and the first week of a new quarter. Some of this decrease may come from the 15% drop in deals created the week of March 23, but the bulk of that impact will likely be felt in the coming weeks, so expect this number to continue shifting. We’ll be watching it closely.
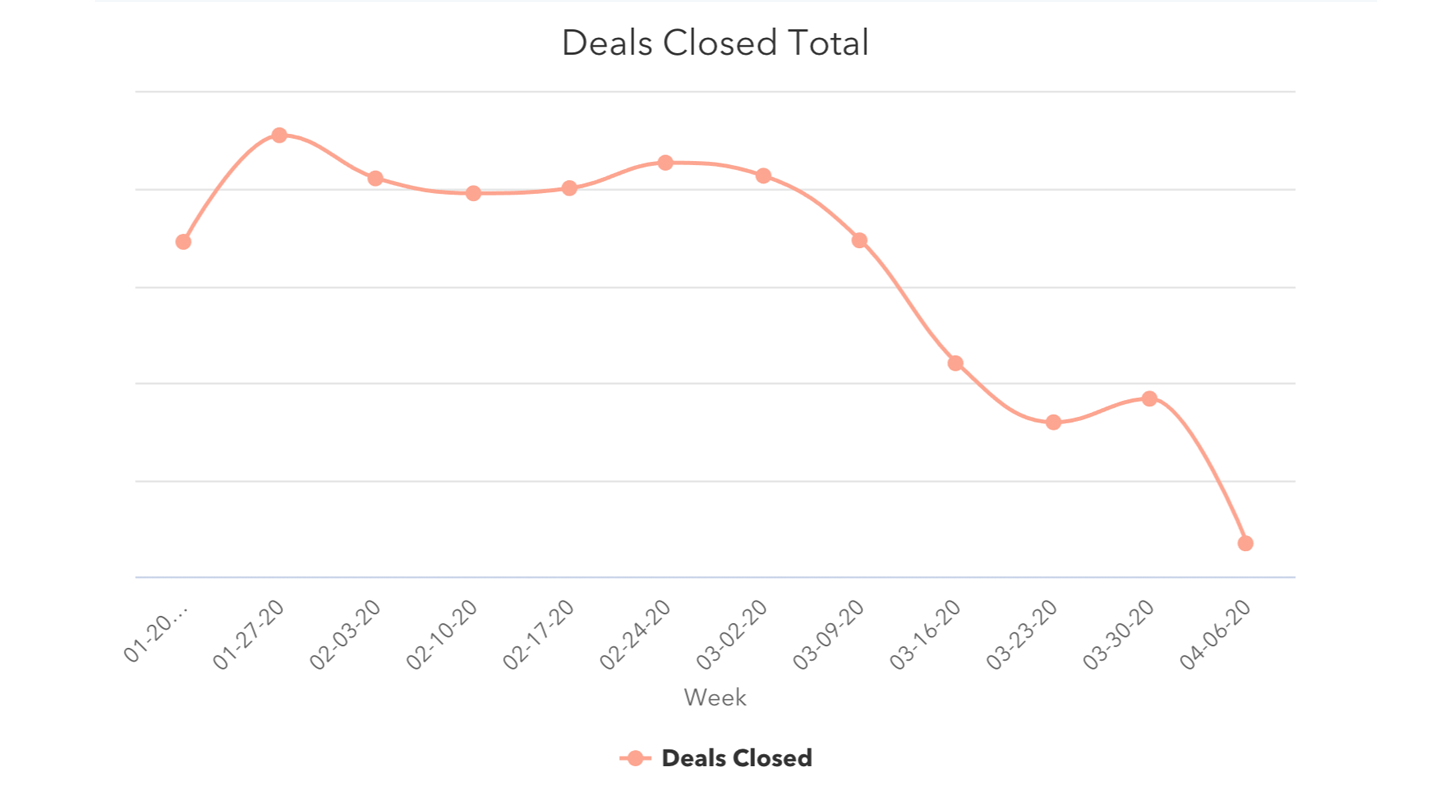
The week of April 6 saw the lowest weekly volume of closed deals this year.
Buyers continue engaging with businesses online.
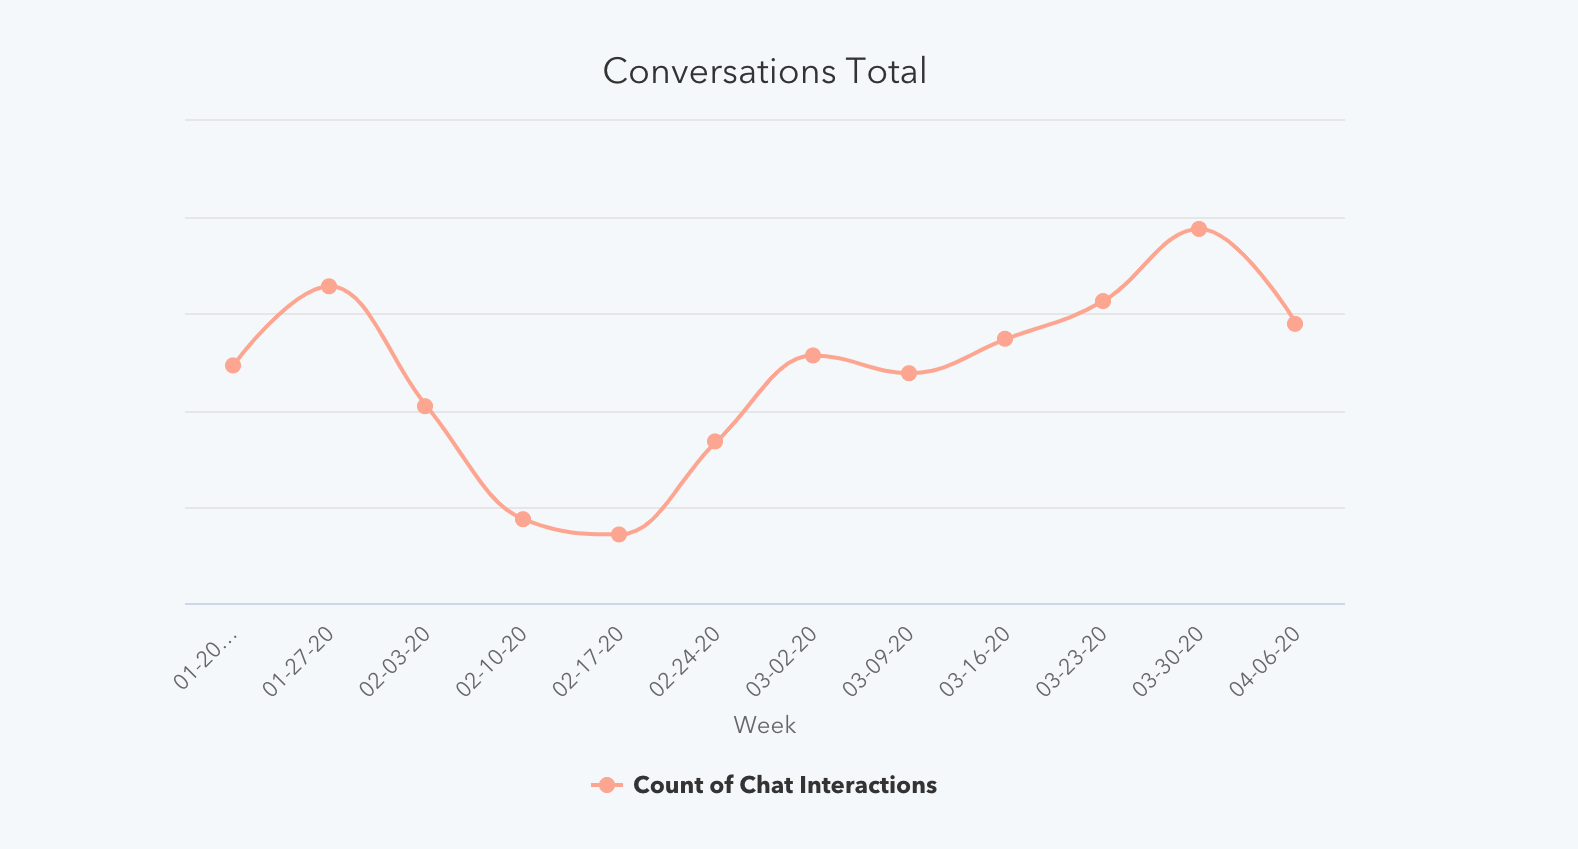
Buyer-initiated chat volume dropped slightly, but is still around 10% higher than pre-COVID levels -- conversational marketing remains valuable to businesses. Database growth has slowed but also has not fallen below February averages.
Other online metrics looked healthy as well. Monthly website traffic increased by 13% in March, compared to February.
.png?width=1070&name=Website%20traffic%20Column%20(1).png)
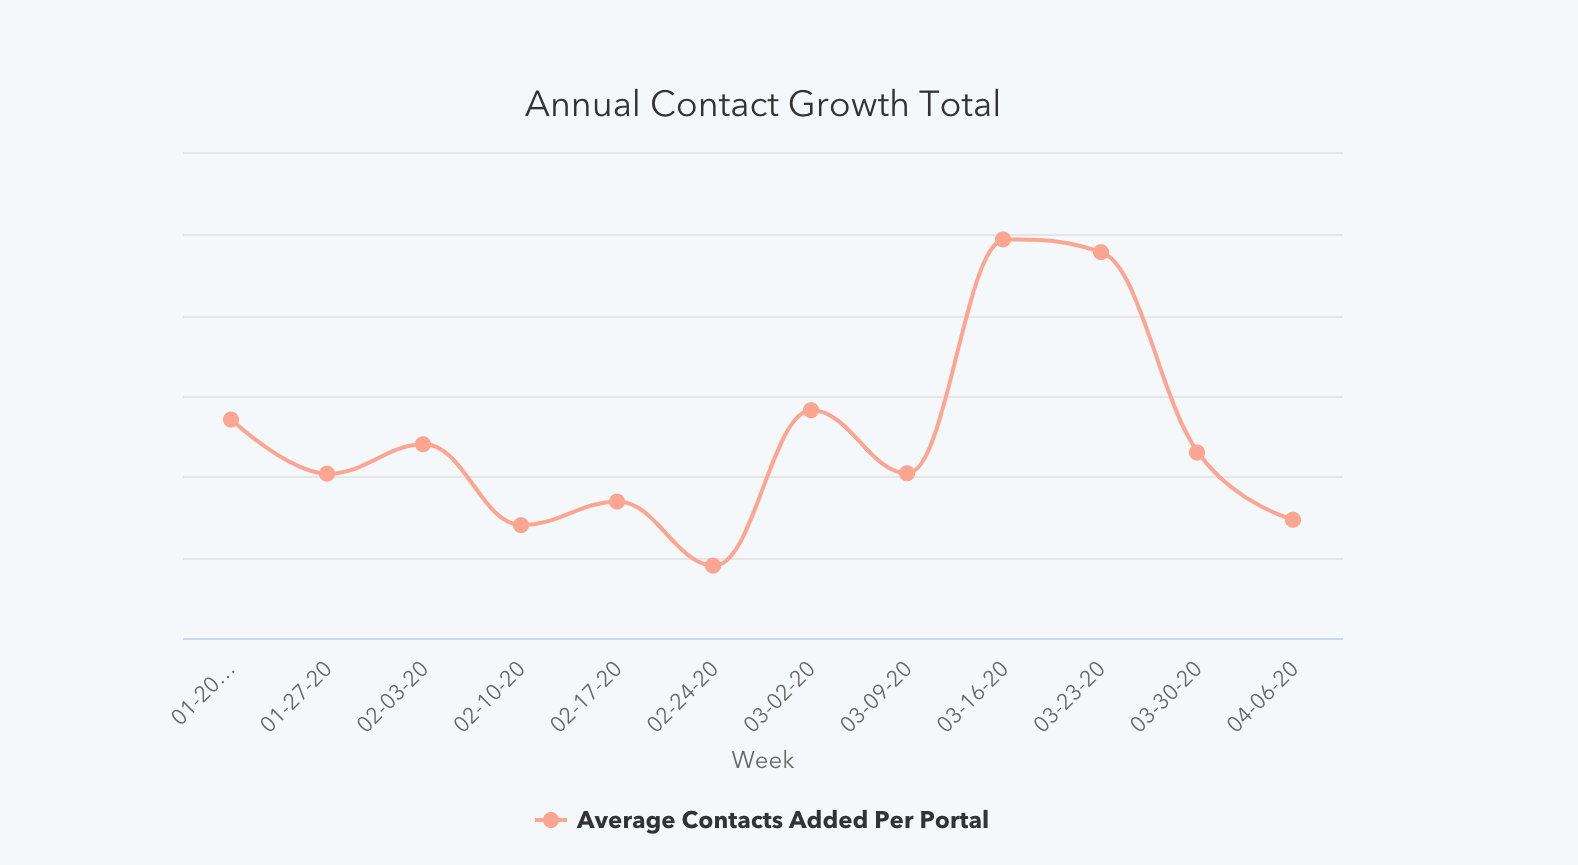
The average number of contacts added to portals dropped 19% last week, after a 36% drop the week of March 30. These look like big drops, but the average weekly number of contacts is still at the same level of February weekly averages. Continue watching this metric closely.
The number of customer-initiated conversations dropped 4.5% the week of April 6, after steady growth throughout March. This drop did not wipe out March’s gains, as last week’s numbers are still well above pre-COVID levels.
Engagement with marketing emails continued increasing and responses to sales outreach reached new lows.
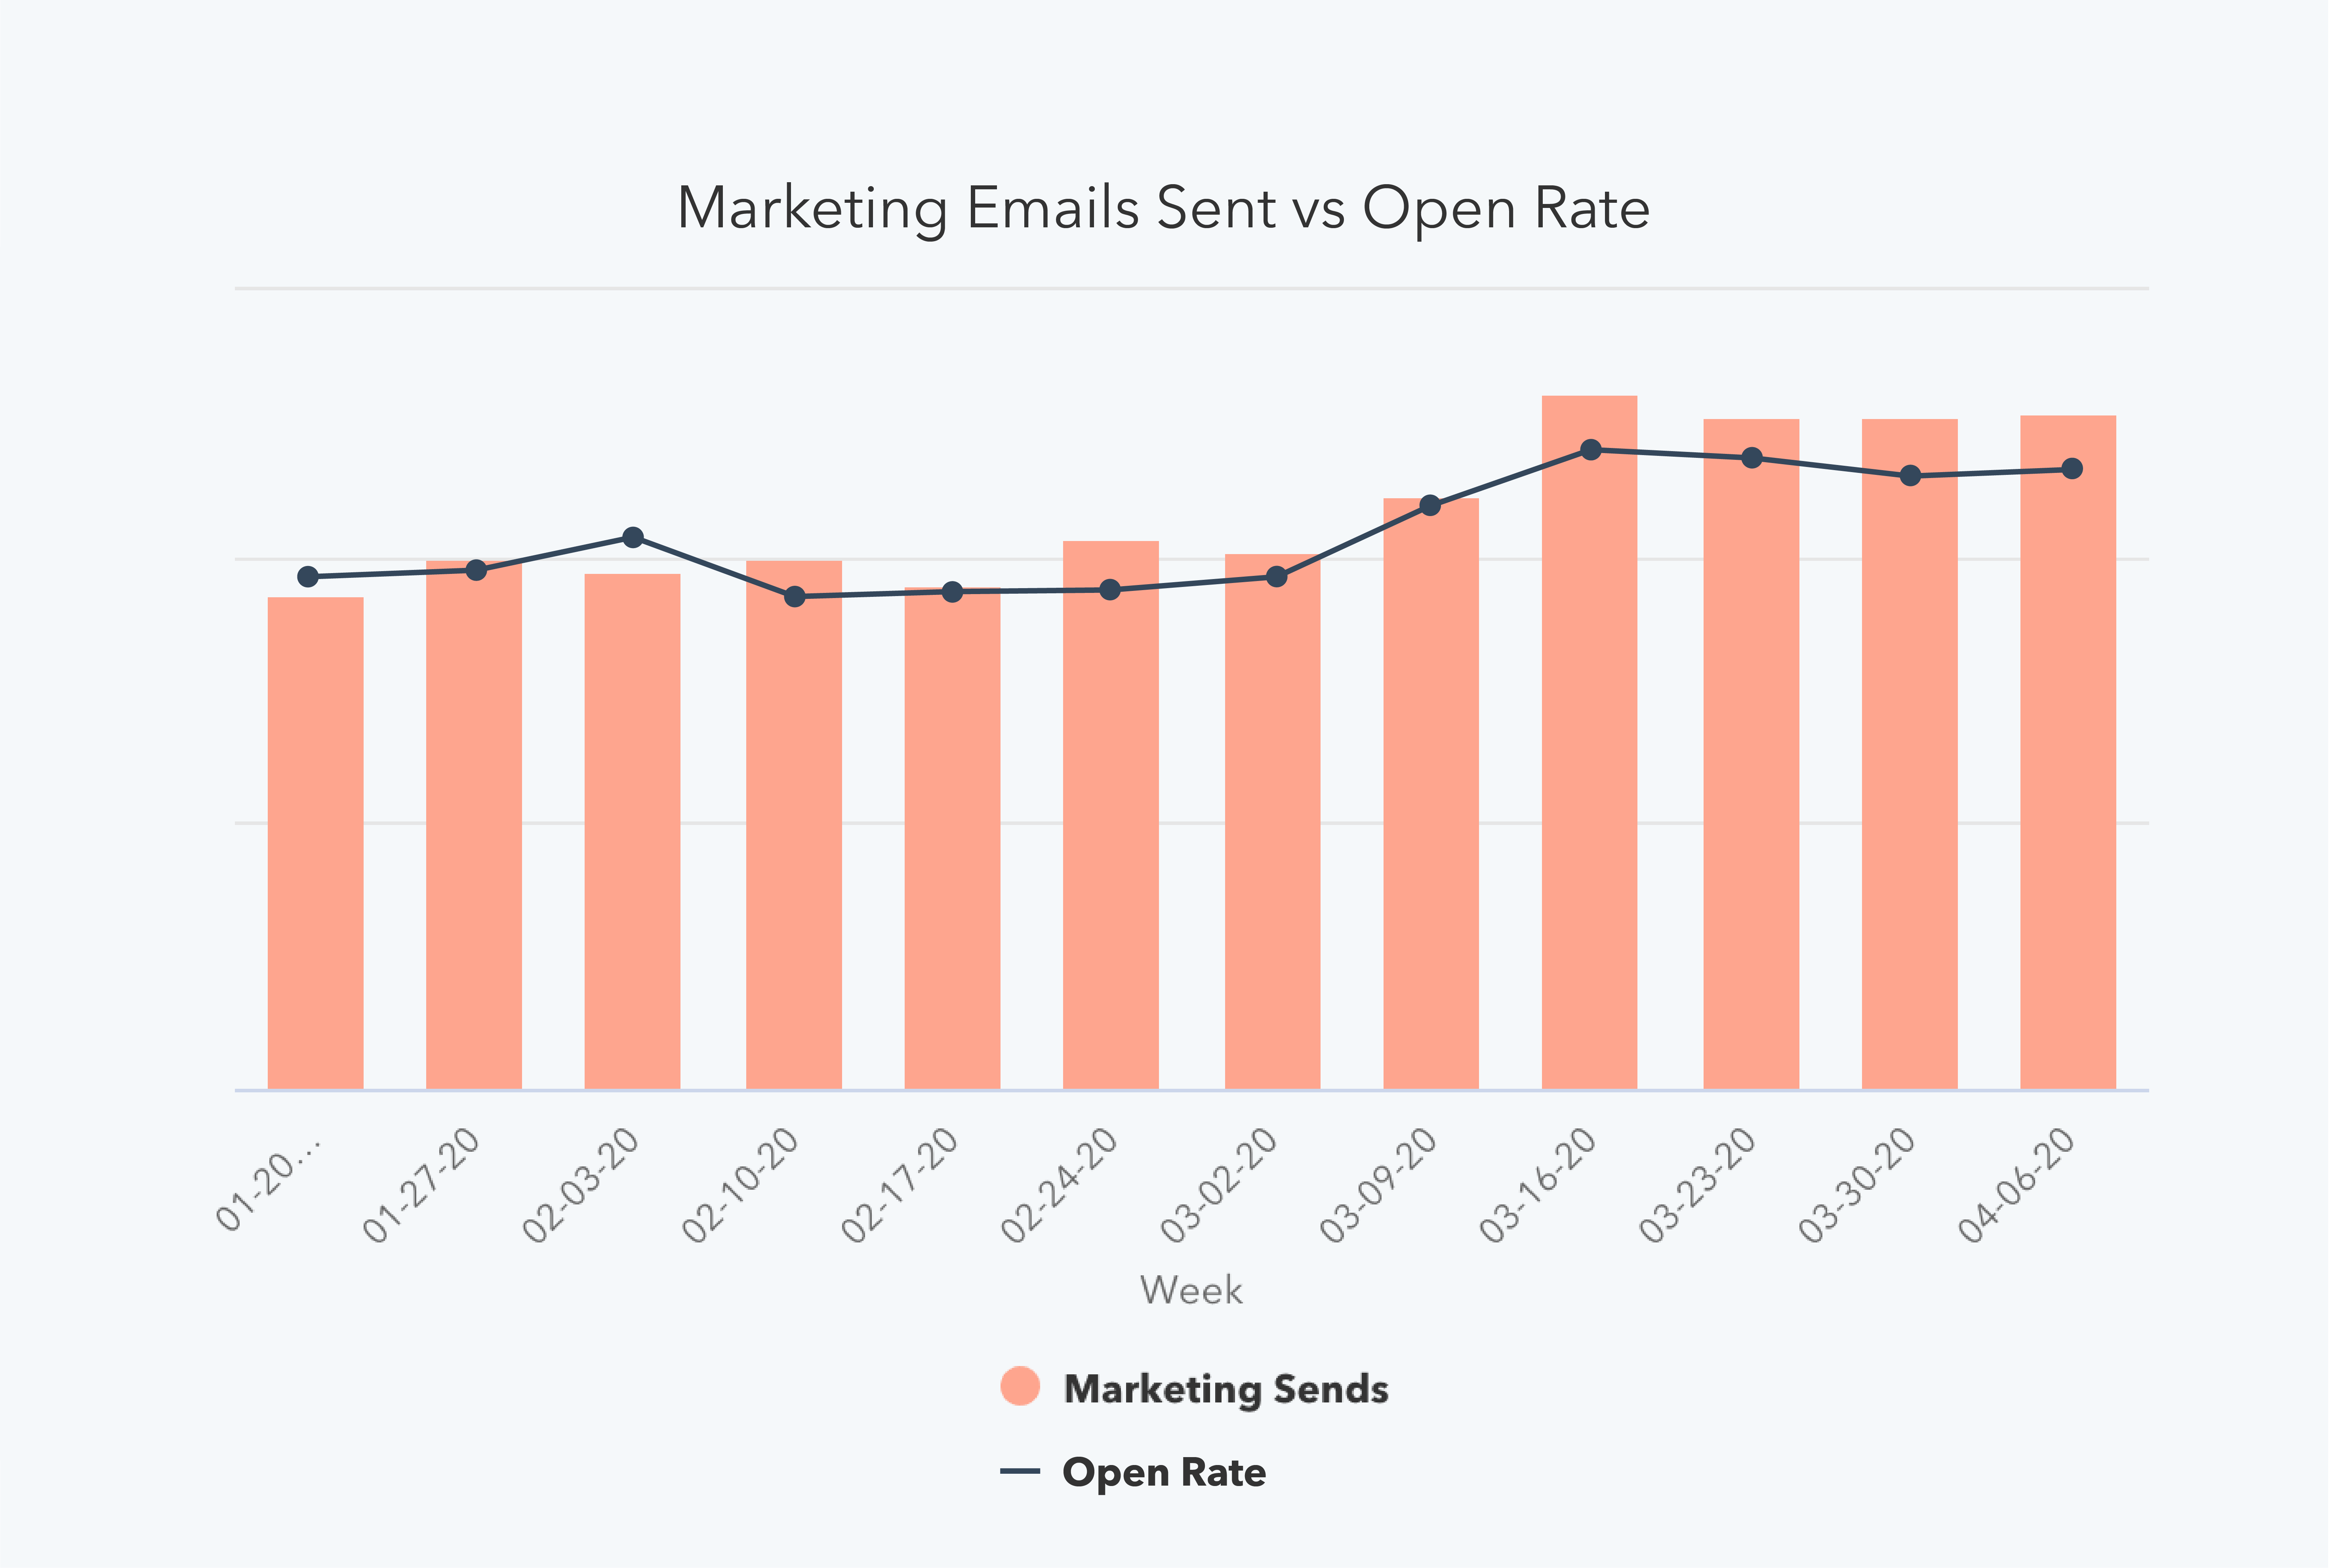
Marketing email open rates increased as volume held steady.
Marketing email volume has held steady the last three week, growing by less than half of a percent the last two weeks. That being said, overall volume the week of April 6 is still higher than pre-COVID levels by about 20%.
Open rates on these emails continue to grow. April 6 saw an open rate of 25.5%, the highest single-week average of 2020, and an 8% increase from the prior week.
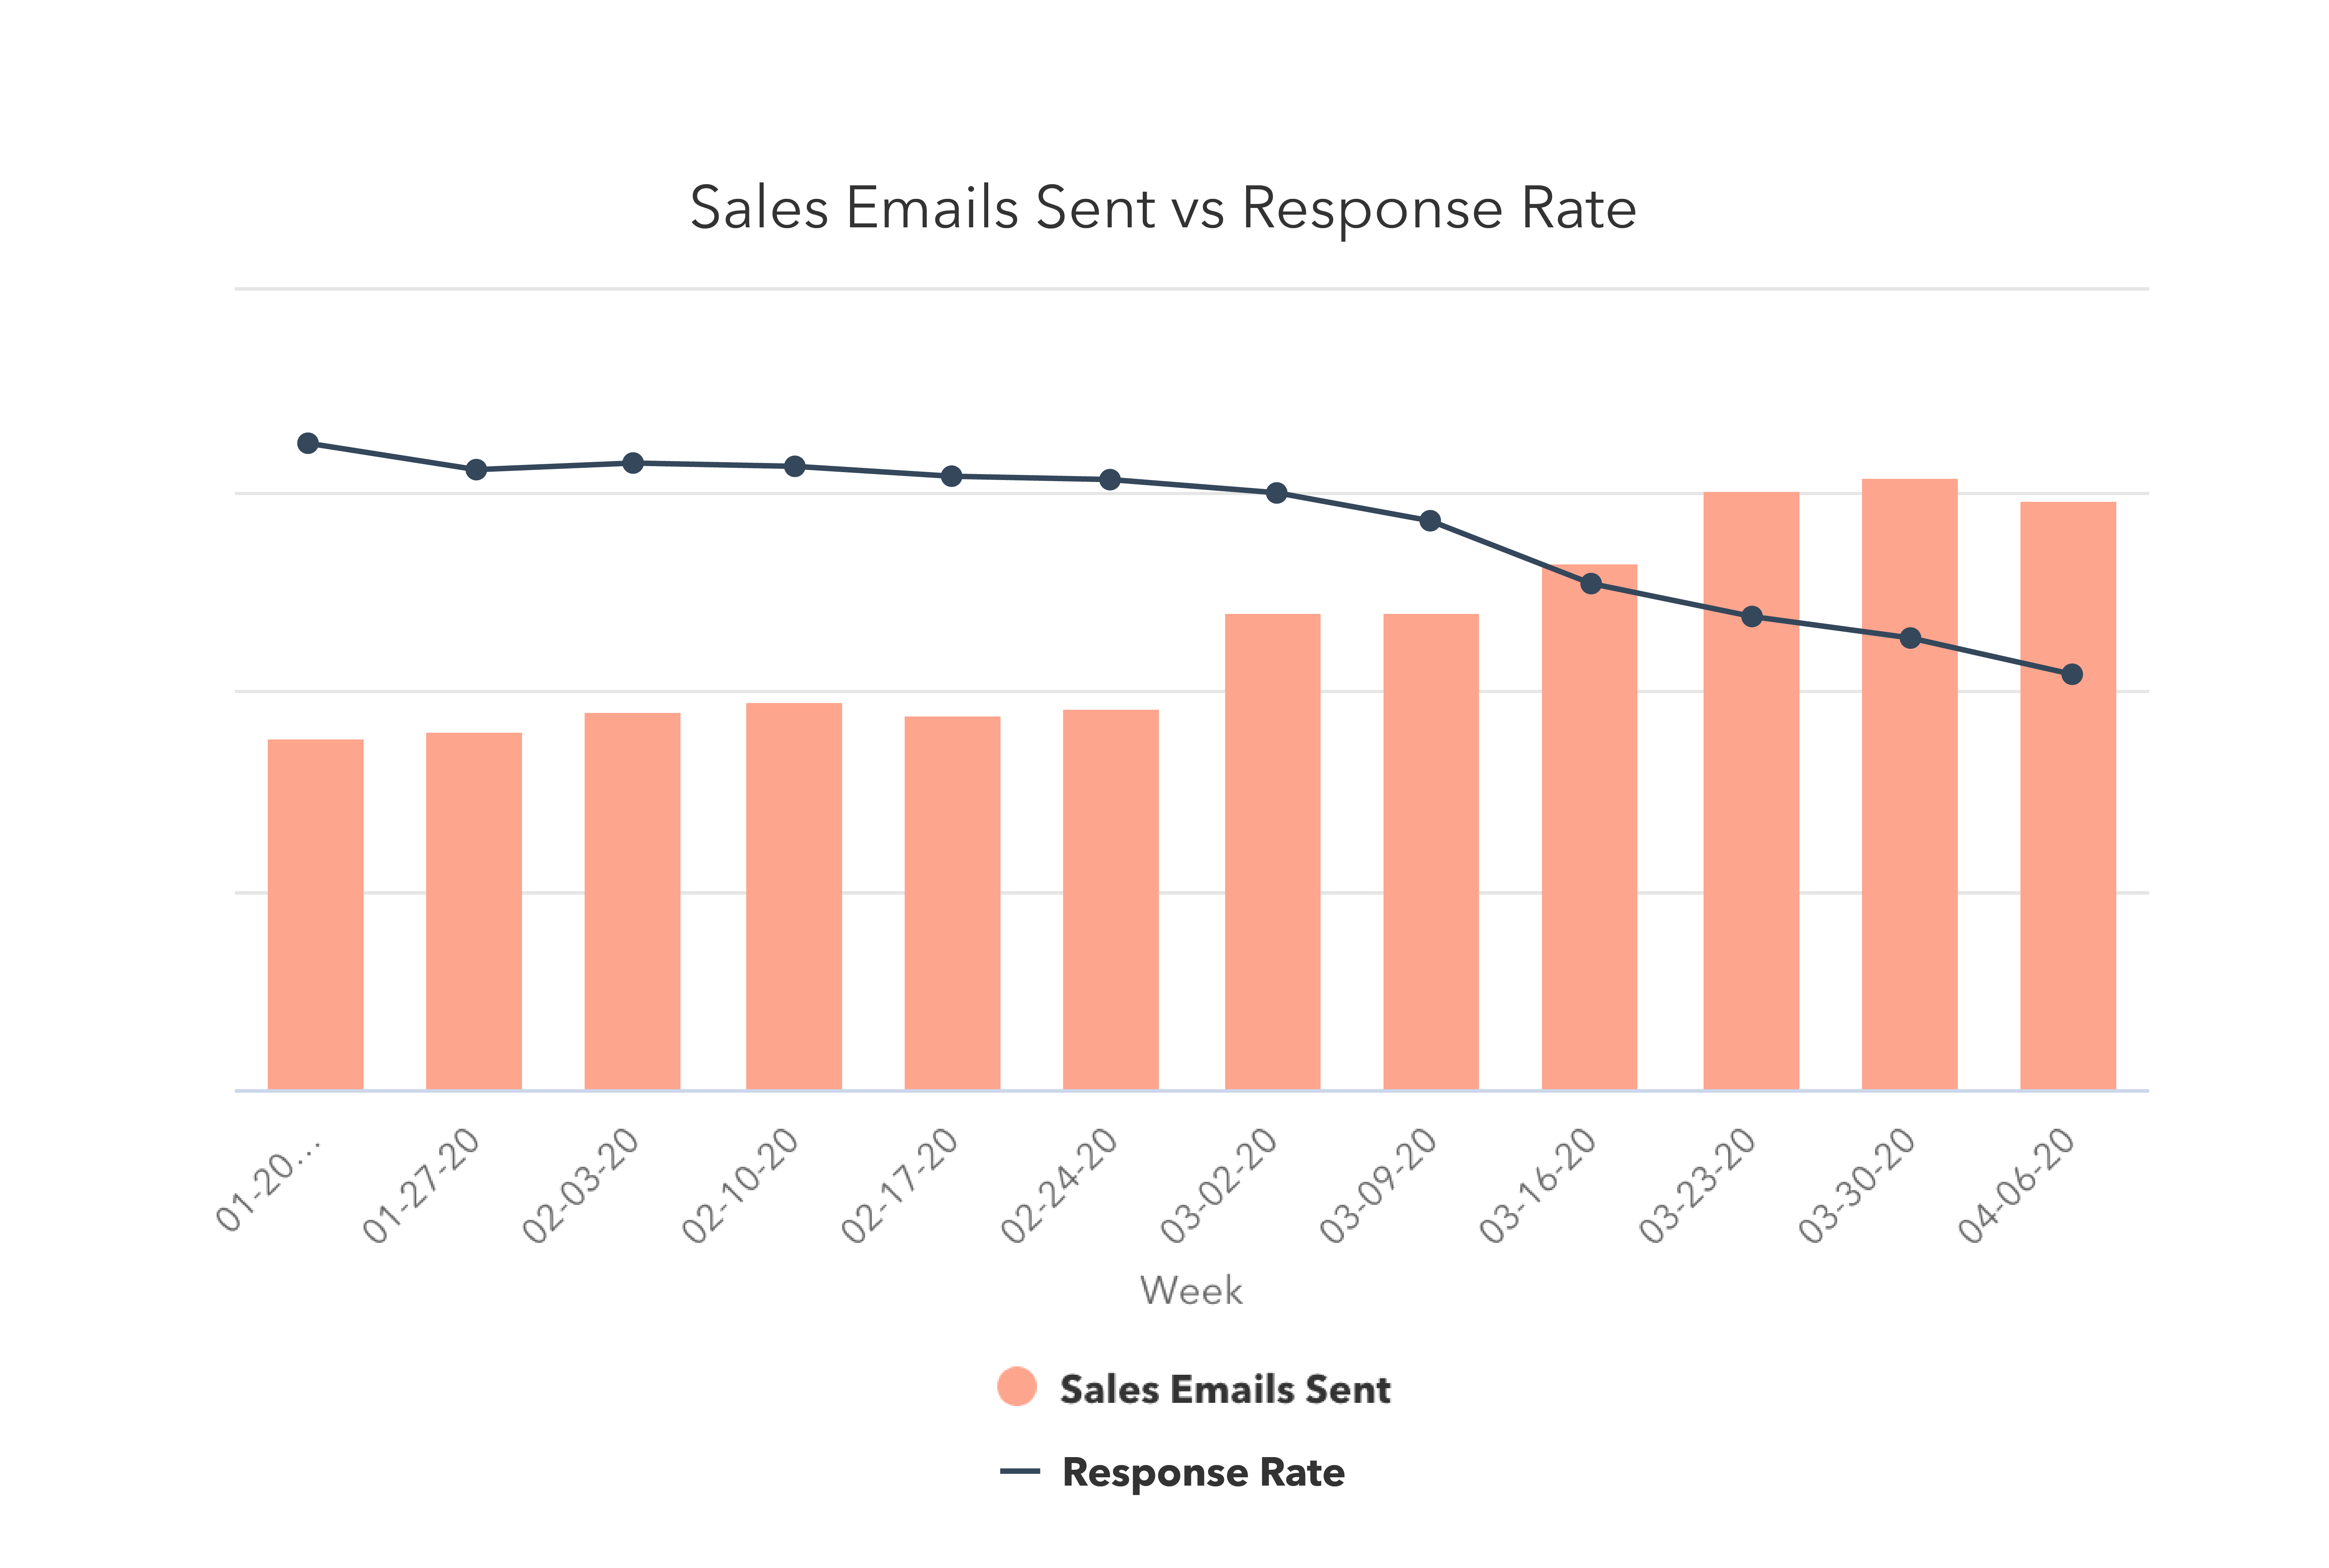
Sales email volume dropped for the first time in eight weeks, as response rates reached a record low.
Outreach was down almost 4% last week -- the first time this number has trended downward since February 17 -- but the total volume of email sent is still around 50% higher than pre-COVID levels.
This prospecting continues to be ineffective. Response rate hit 2.1% last week, which is a 10% lower response rate than the week of Christmas in 2019. This is the lowest weekly response rate of 2020 thus far, and 40% lower than the highest response rate of the year (3.51% the week of January 6).
Transitioning to remote work for the first time? We teamed up with Slack to create this guide to moving your business online.
What This Means for Businesses
Targeted prospecting matters more than ever.
This week’s headline is the 11% drop in new deal creation, while sales outreach still remains far higher than pre-COVID levels. Some increase in email prospecting is expected as outside sales teams have transitioned inside, but this doesn’t fully account for the acceleration of sales outreach. Instead, the data suggests that many sales teams have reacted to the economic climate by reaching out to a significantly broader base of prospects than they normally would target.
Not only is this ineffective -- response rates hit their lowest levels in 2020 last week -- it’s a foreboding sign for longer-term sales forecasts as well. As deal creation is the best indicator of future revenue, course-correction needs to happen quickly. Many businesses will need to rethink what prospecting looks like to bolster their long-term pipeline.
Operationally, regularly adjust your sales projections to reflect potentially extended sales cycles or lower deal size so forecasts remain accurate. Just a touch of process (or improvements to existing processes) goes a long way in creating a clear picture of your business over time.
On individual calls, encourage your team to emphasize a helpful, consultative selling approach. Certain factors, like your customers’ budget and willingness to enter sales conversations at this moment, are out of your control. Instead of cold calling your whole database, use your knowledge of your customers’ industries to prioritize reaching out to:
- Industries that have been minimally impacted or those that are transforming quickly to meet the new challenges
- Industries where your solutions are particularly relevant or useful in this moment
We hope to see sales outreach trend down toward pre-COVID levels accompanied by higher response rates in the next few weeks, which would indicate that companies are doing a better job of targeting buyers who have shown interest in their products.
Resources to Help
- Rework your sales projections with this guide to sales forecasting and sales forecast template
- Maintain an accurate forecast with this sales pipeline tracker
Free Software to Get Started
- HubSpot CRM is free and comes with included sales acceleration tools
- Gmail and Google Calendar integrations with HubSpot
- Zoom integration with HubSpot
- LinkedIn Sales Navigator integration with HubSpot
Focus on education, not promotion.
The increase in website traffic and marketing email open rates suggest that customers are still looking to engage with companies.
Your customers may be more interested in learning and education right now. Our own website has seen an uptick in visits to educational resources like our blog, certifications, and Academy classes.
Instead of dialing up the promotion of your products and services during a crisis -- an approach that may be insensitive to your customer base, focus on nurturing the long-term relationship. Identify where you can help your customers today, without asking for anything in return.
Resources to Help
- Use this editorial calendar template to plan educational content
- Get started writing with these blog post templates
- Optimize content and get found online with our guide to SEO
Free Software to Get Started
Incorporate chat into your strategy.
While chat volume declined week-over-week, total volume still far exceeds pre-COVID levels. Conversational marketing offers a real-time way to answer customer questions, as well as automating the lead routing process so your business can serve prospective and existing customers even when your team is out of the office.
Investing in chatbots to get customers answers more quickly, automate lead qualification or book meetings can help your company meet the increase in customer inquiries.
Resources to Help
- Get up to speed with this beginner’s guide to conversational marketing
- Learn how marketers are using conversational marketing in 2020
Free Software to Get Started
- Free conversational marketing tools are included in HubSpot CRM
- Facebook Messenger integration with HubSpot
We hope these benchmarks provide useful context as you monitor your business’ health in the coming months. We plan to refresh these insights and add further breakdowns over time (such as by channel and company size). You can sign up to be notified of new insights as they’re available here.
No comments:
Post a Comment